One of my regrets from my time at university, studying physics, was that I chose to study a module called “the galaxy” instead of studying statistics. All my friends who chose statistics sailed through the class with high marks, while the course I chose was a poorly taught mess of arbitrary facts to learn, and I did very badly on the exam. I think a good working knowledge of statistics is also much more useful in the real world. So I was hoping this book might fill in some of the gaps in my statistical knowledge.
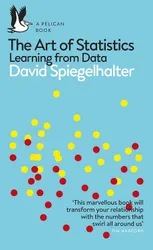
The title and cover image (which depicts some kind of visualisation with red and yellow dots) suggest that this book might be focused on the ways in which statistics can be visualised, and how we can express statistical data with diagrams and pictures. There are several diagrams throughout the book, and some places where a good visualisation allows us to see clearly what the data is telling us, but this isn’t the main focus of the book either.
So instead of being a general introduction to statistics (for which I’m sure there a good textbooks available), or a book about statistical visualisations, the book is instead a general overview of how statistical methods can be used to answer questions from data, and the complexities that this involves.
The book starts in rather a morbid fashion, asking the question of whether the British doctor and serial killer, Harold Shipman, could have been caught earlier by analysing the pattern of deaths within his medical practice. Throughout the book there are several questions like this, covering subjects like political elections, the effect of diet on health, and the effectiveness of medical treatments. Spiegelhalter uses these examples to introduce concepts around statistics and how data can be processed and interpreted in order to answer such questions.
The author seems to be trying to strike a balance between being correct and thorough on statistical topics, while remaining readable and understandable to a lay reader. I don’t think he’s particularly successful at this. While I think the author is able to get across the importance of interpretation of data, and the complexity of doing so correctly, I found some of the text quite hard to understand. This was especially the case when Spiegelhalter was attempting to explain a mathematical concept without using equations. In places, it became a bit of a thick soup of statistical terminology that I found difficult to penetrate.
The examples chosen in this book are very engaging, and the diagrams are excellent. The explanations, while they did lose me on the details sometimes, did shed some light on the challenges faced by statisticians in interpreting data and communicating the results. There is a section in this book on the use of statistics in science. This covers some of the same issues with p-hacking and the replication crisis that were covered in Science Fictions.
I have to admit to finding it a bit of a chore to get through this book. There were just too many times when the language got too complex and it got in the way of understanding. If you’re new to statistics then this might not be the best introduction to the subject. But it is an interesting read that will open your eyes to the ways in which statistical analysis can affect the conclusions we draw from data.
